FirstSteps
Table of Contents
First Steps
Welcome to Oaklean! This guide will help you install, configure, and start using Oaklean in your project.
Installation
Oaklean can be added to your project using your preferred package manager (pnpm currently not supported):
npm
npm install @oaklean/profiler
yarn
yarn install @oaklean/profiler
Initialize Oaklean
After installation, initialize Oaklean in your project directory:
npx oak init
1. Select your Sensorinterface
Select a sensor interface (recommended for your platform: perf)
  None (pure cpu time measurements)
  powermetrics (macOS only)
❯ perf (Linux only)
  windows (Windows only)
energy measurements on Linux (Intel & AMD CPUs only)
2. Confirm the config generation
✔ Select a sensor interface (recommended for your platform: powermetrics) perf (Linux only)
[Oaklean] [Main Config]
{
  "extends": ".oaklean.local",
  "exportOptions": {
    "outDir": "profiles/",
    "outHistoryDir": "profiles_history/",
    "rootDir": "./",
    "exportV8Profile": false,
    "exportReport": true,
    "exportSensorInterfaceData": false
  },
  "projectOptions": {
    "identifier": "XXXXXXXX-XXXX-XXXX-XXXX-XXXXXXXXXXXX"
  },
  "runtimeOptions": {
    "seeds": {},
    "v8": {
      "cpu": {
        "sampleInterval": 1
      }
    }
  }
}
[Oaklean] [Local Config]
{
  "runtimeOptions": {
    "sensorInterface": {
      "type": "perf",
      "options": {
        "outputFilePath": "energy-measurements.txt",
        "sampleInterval": 100
      }
    }
  }
}
? Is this OK? (yes) (Y/n)
Available Sensor Interfaces
| SensorInterface | Operating System |
|---|---|
| powermetrics | macOS |
| perf | linux |
| windows | windows |
If you want to how to setup the Sensor Interfaces and how to make them work with Docker you can read more about it here
⚠️ Most Sensor Interfaces need root privileges
Look into the Sensor Interface Docs to see how you can run them without root privileges
🔍 How measurements work
During the test execution measurements are collected with a sample based approach. So for every n - microseconds it collects a v8 cpu profile and energy measurements of the sensor interface. You can adjust the sampling rate with thesampleIntervaloptions in the.oakleanconfig file above.
First Measurement
To perform your first measurement with Oaklean, simply import the profiler and wrap the code you want to measure. The basic structure looks like this:
Javascript
// script.js
const { Profiler } = require('@oaklean/profiler')
const profile = new Profiler('profile-name')

async function main() {
  await profile.start('test')
  // code to measure
  for (let i = 0; i < 1e6; i++) {
	  Math.sqrt(i)
  }
  await profile.finish('test')
}
main()
Typescript
// script.ts
import { Profiler } from '@oaklean/profiler'
const profile = new Profiler('profile-name')

async function main() {
  await profile.start('test')
  // code to measure
  for (let i = 0; i < 1e6; i++) {
	  Math.sqrt(i)
  }
  await profile.finish('test')
}
main()
Running the Code
For basic CPU-time measurements, you can simply run:
node script.jsnpx tsx script.ts
If you also want to measure energy consumption, you may need to run the script with administrator privileges, depending on your Sensor Interface. For details, see the Sensor Interface Docs
Where are the measurements
After running a script that uses Oaklean to measure your code, the results are exported to the ./profiles directory by default. You can also configure a custom location in the .oaklean config under exportOptions -> outDir.
Measurement files have the .oak file extension.
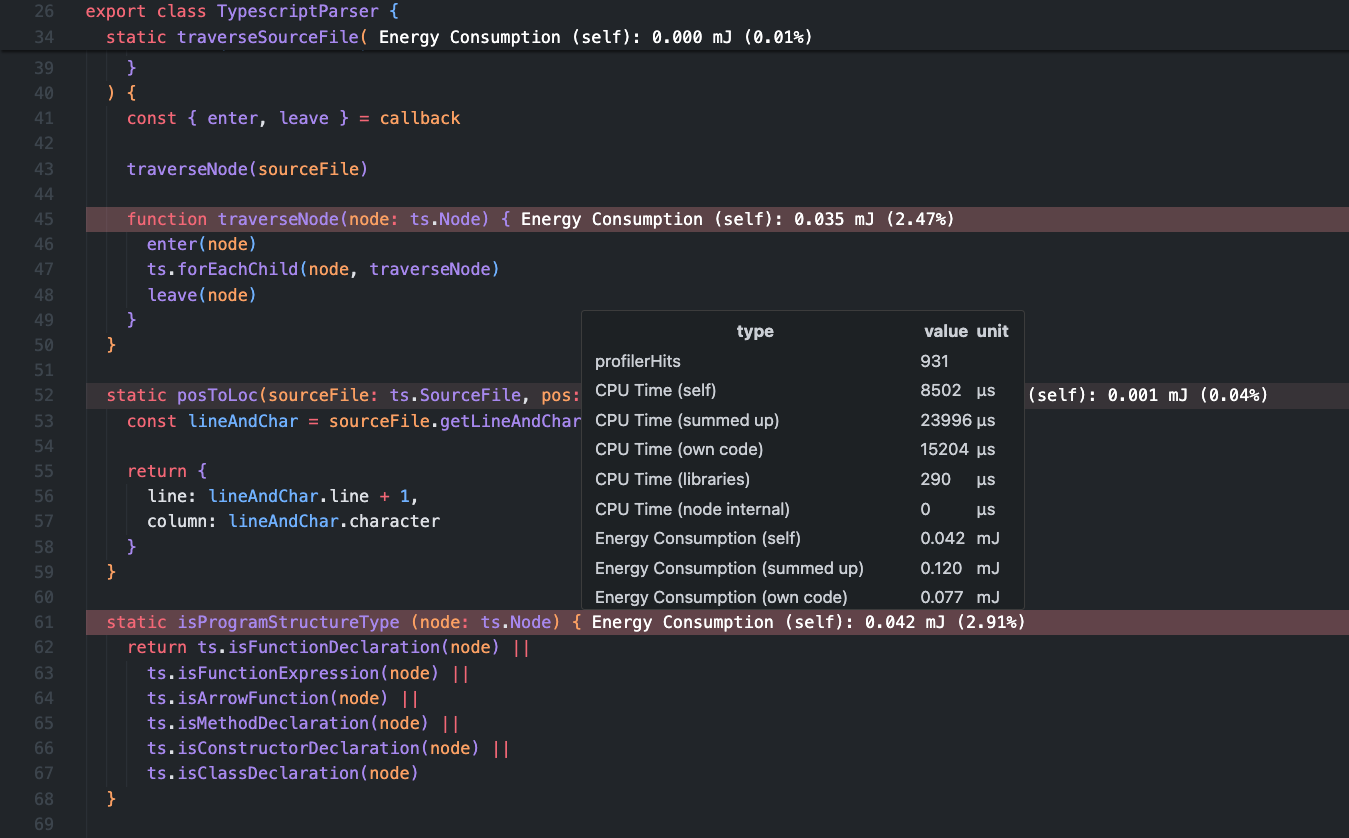
Visualize the measurements in VS Code
Install the VS Code extension
To visualize and interpret your measurements, install the Oaklean extension for VS Code. You can download it from one of the following sources:
Import a measurement report
To view a report:
- Open the
.oakfile in VS Code by right-clicking the.oakfile and selecting “Select Project/Module Report” - The measurements will load, and you can explore them further by clicking the Oaklean icon in the sidebar.
For detailed guidance, see the Oaklean VS Code Extension Github page